Processing is one example of the many ways in which technology has been adapted into the world of art. With lines of code, art is possible in many interactive, dynamic and innovative ways. It has been used by famous artists in order to display their art on screens, rather than on paper or canvasses, as was the custom before the internet. Design through coding is in many ways restrictive to what the coding language may provide for the artist, but in other ways, allows for new ways to explore this design, and opens up a series of possibilities that were not possible before; possibilities that include, but are not limited to, motion or animation design.
In the following series of images, I have explored designing with Processing in a series of images or interactive elements. In order to show these interactive elements, I have filmed my screen as I interacted with the code and then converted it into a gif image in Photoshop.
After having created my own designs (above), I followed the tutorials on Processing.org in order to re-create some designs that have been posted by other people online and showcase the different ways in which others, aside from myself, have used the processing code to create art.
There are, of course, more complex ways of using processing as a design tool, with advanced skills in coding. For example, in the video below, Till Nagel and Christopher Pietsch used processing to create a comparative visualisation of the sociotemporal patterns of shareable bicylcle systems in three major cities in the world to compare their extent and dynamics.
The full project can be accessed on: https://uclab.fh-potsdam.de/cf/
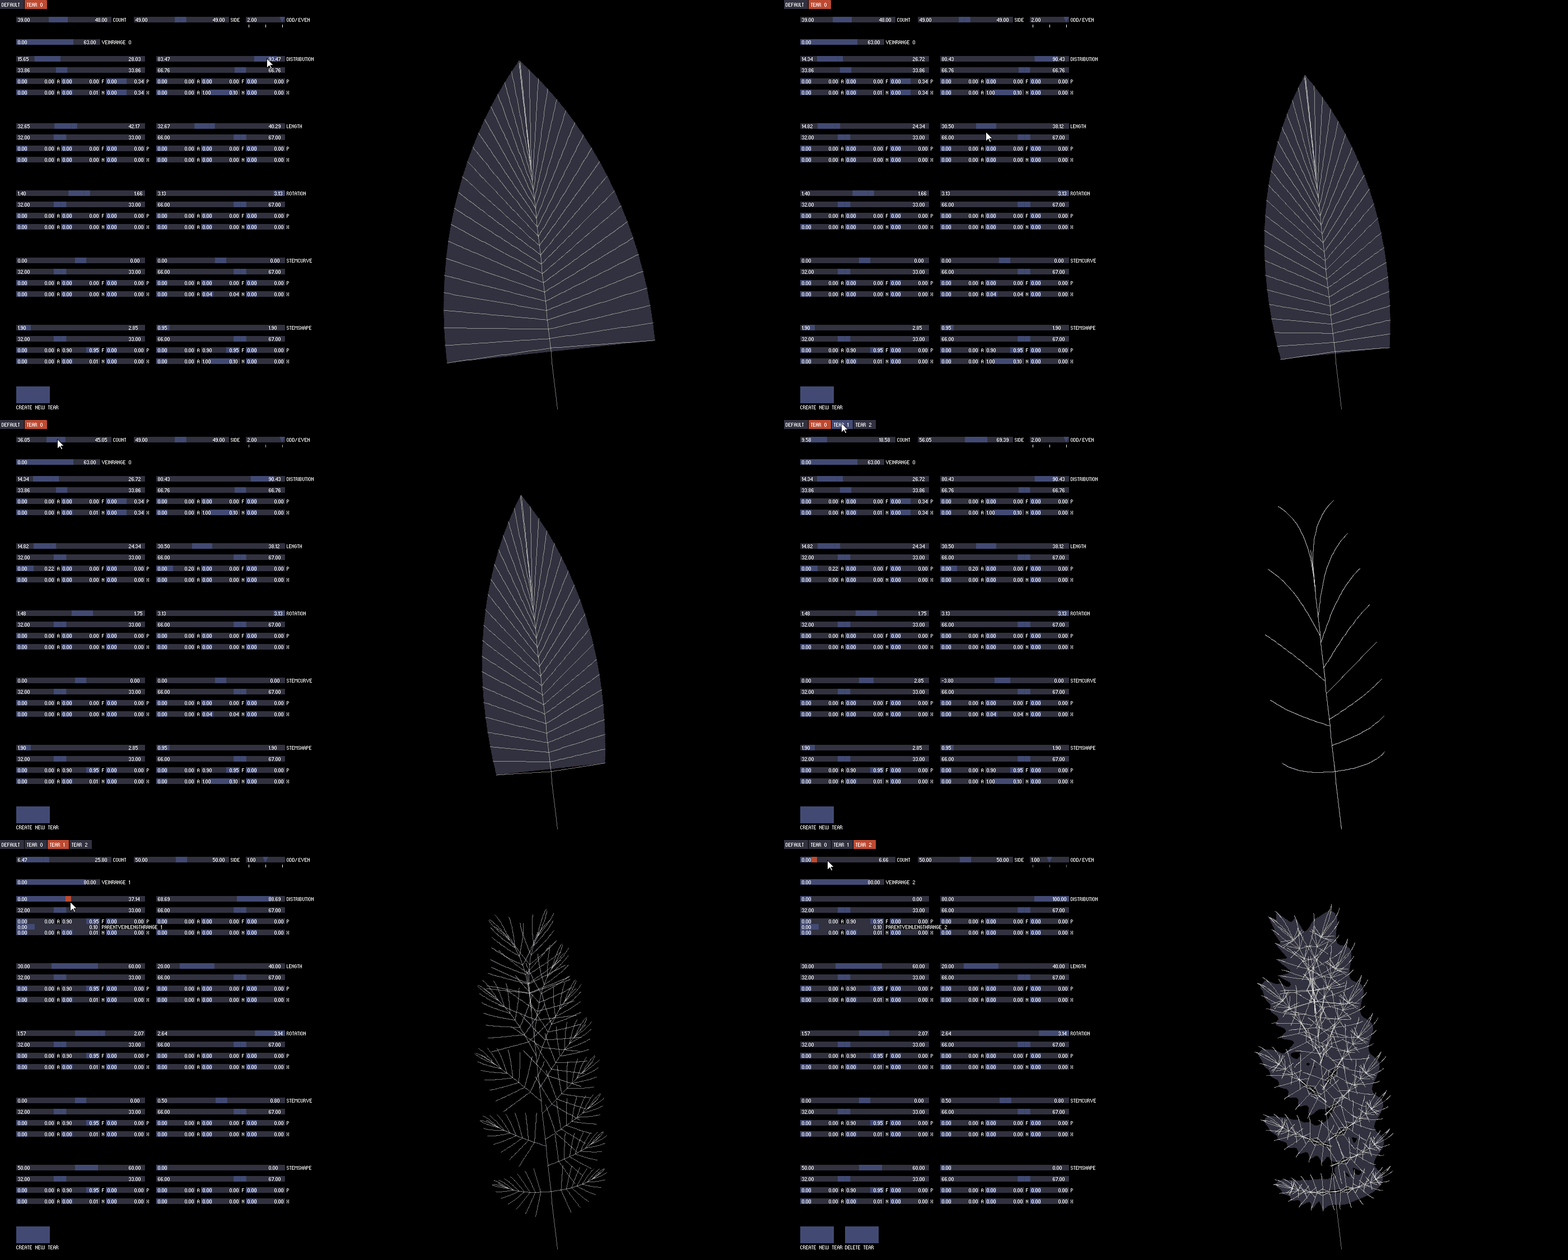
Another more complicated use of processing for design can be seen in the gif image below. While the project shown above uses processing to show dynamic information and compare and contrast different sorts in an engaging manner, the one below has used processing in order to create a program that will generate randomised patterns of leaves that never overlap each other. These patterns are then turned into a design piece to be used on all sorts of objects. It shows a way to digitalise and randomise something that before technology, would need to have been individually and manually decided upon. The randomisation options that technology offers us as designers allows for more freedom of 'happy accidents' in art.
The full project can be seen here: http://reinoudvanlaar.nl/project/leavespattern/
The last exercise from the Processing and Data Gathering workshop was to create a visual map of a set of data. In the example given, the data was wool and how much was collected over a period of months, which resulted in the following image:
Using this as a template, I decided to gather my own data in order to display it in a similar manner using Processing. I picked one of my favourite books, Pride and Prejudice, and recorded in a spreadsheet, using Pages, the spreadsheet application by Apple that comes with my laptop, the number of times that the main characters' names were mentioned in the book. Once done that, I inputed these new data into the Processing file, replacing the values with my own, and changing the layout and colours as well. Below are the screenshots of my process.
"Processing is a flexible software sketchbook and a language for learning how to code within the context of the visual arts." It can be downloaded for free from www.processing.org. 'Hour of Code' is an introduction to Processing which teaches you the basics of the program via a series of videos and interactions, as shown below.
